
Visualizing an analytical lesson about data.
Detail 1
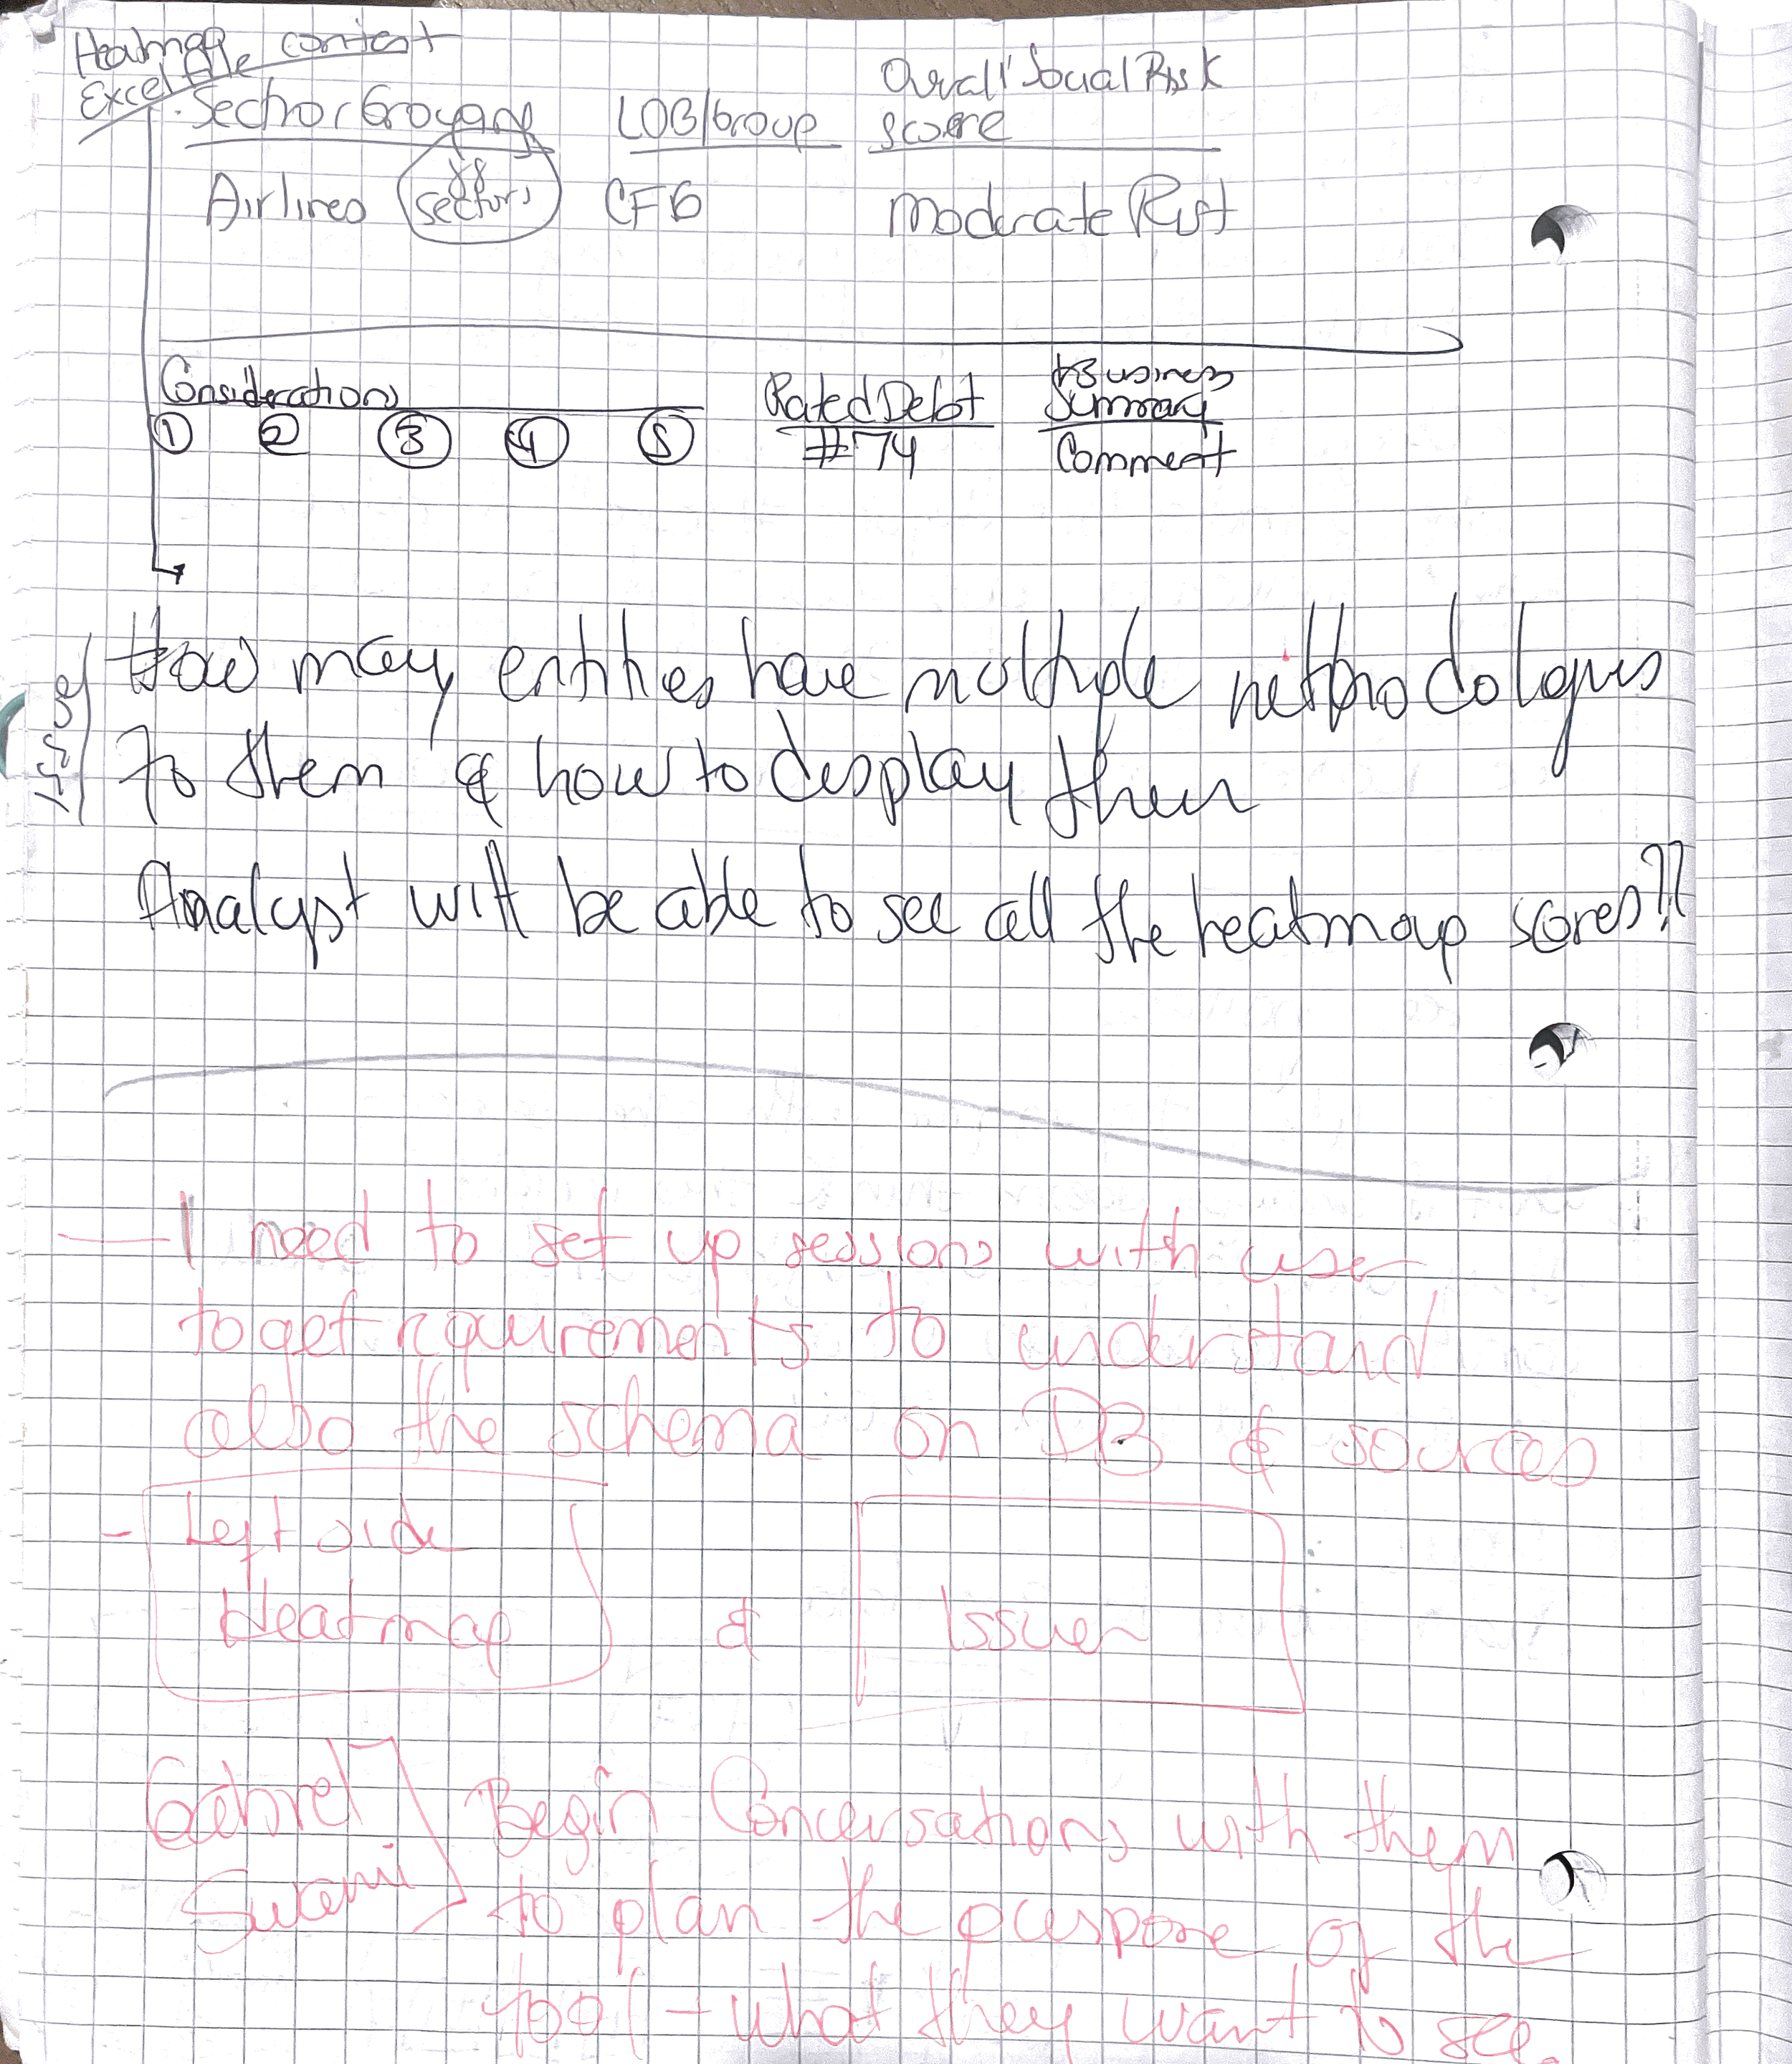
Shows me questioning numbers and terminology to make sense of what the data I will be working with and alternate ways to understand what is being presented as tables.
Detail 2
Sample notes for the Analytical HUB and more visualizing analytical explanations

Detail 3
Questions to ask users / analysts
Annotations on what type of information and how will the user interact with it - also I annotate items I may need to account for or think about.
I sketch out the conversation as it is happening, or if we have a screen available, I would modify past interfaces to fit the conversation
I keep track of who is related to the conversation, I sketch ideas, color code - love my color pens different parts of the conversation in one page to be able to refer back fast when needed

Detail 4
Aliquam bibendum, turpis eu mattis iaculis, ex lorem mollis sem, ut sollicitudin risus orci quis tellus. Quisque congue porttitor ullamcorper.